RentNYC | Model-based Evaluation of Rental Prices
New York City consistently ranks among the most expensive big cities in the United States to rent an apartment. Many factors determine rental prices and apartment-seekers could benefit from a simple metric to evaluate whether the price of the apartment is justified. Put simply - How can I tell if I’m getting ripped off?
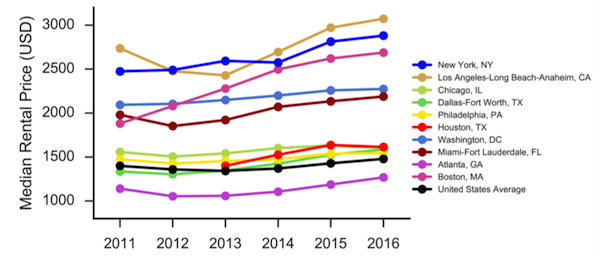
Figure 1. Median monthly rental price for the 10 largest US metropolitan areas over the past six years and US average. Plot was generated using raw data from Zillow Research Data.
The project had three overall goals to extract value from data:
- I developed a web scraper to generate a clean and formatted data set of rental listings from Streeteasy.com. Most public APIs only provide aggregate data, but my data set provides individual listing information and novel features such as distances to nearby transportation and amenities. Data available here.
- I developed a model to predict rental prices based on the scraped data. I developed a cluster-based bootstrapping program to determine features that significantly improved prediction accuracy. Modeling code is available here.
- I integrated the model into a web application called RentNYC that provides non-technical users with an intuitive interface to generate visualizations comparing actual and expected listing prices. Please try it out!
Data Overview
I wrote a web-scraping program to retrieve information about individual rental listings from the online rental site Streeteasy.com. The web scraping code is available at the streetasy_scrape respository. Briefly, I navigated pages using Beautiful Soup, a standard Python package for processing HTML. The program was executed daily over a three-month period (11/02/2016 – 1/31/2017). For each scrape, the program retrieved every available rental listing (~27,000 listings per scrape). Key variables were collected for each listing including price, square feet, bed rooms, unit type (e.g., rental unit, condo, town house, etc), days on the market, amenities (e.g., bike room, doorman, washer/dryer in unit, etc), and distance to nearby subway lines and train stations. You can find more details and download the data set from the streeteasy_scrap repository.
The overall distribution of prices was positively skewed. I restricted my analyses to listings under $20,000 per month (99.27% of total data set) to reduce the influence of outliers (i.e., ultra-luxury apartments).
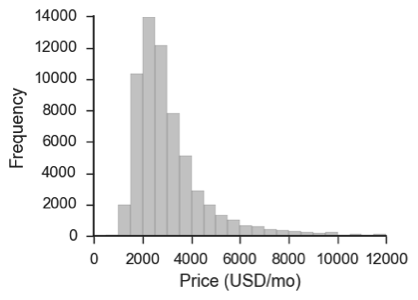
Figure 2. The distribution of prices in the final data set.
For listings that included square footage, there was a strong interaction with location. The price per square foot was highest in Manhattan and lowest in Bronx. The relationship was reasonably linear except in the upper tail.
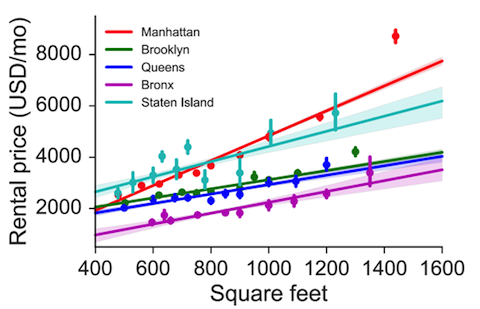
Figure 3. Mean price by square foot for each borough. Error bars are SE. Lines are fits with linear regression. Shading is 95% confidence interval.
The data also suggest a relationship between price and nearby transportation. Ignoring all other factors, the rental price increased steeply with the number of subway stops within 1.5 mi and there and there was a clear influence of distance on the overall rental price. This information may increase prediction accuracy.
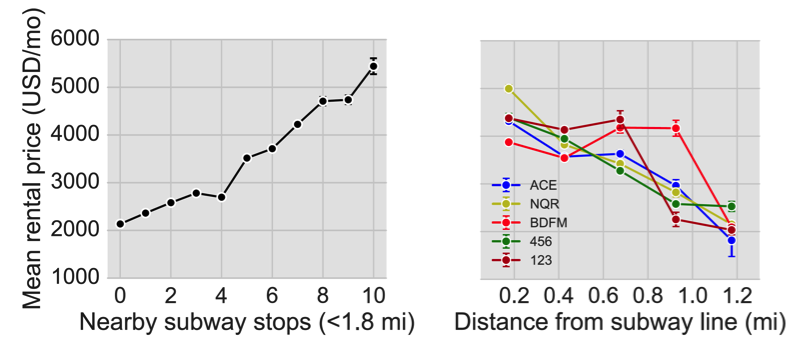
Figure 4. Mean rental price increases with more nearby subway stops. (Left) Price increases with more nearby subway stops within ~2 miles. (Right) Price decreases with distance from a subway line for all lines. Error bars are SE.
Data Processing
Details of the data cleaning process are summarized in the exporatory_analysis notebook in the GitHub repository . The data were cleaned sorted into a Pandas Dataframe and saved to a .csv file. Duplicate observations were dropped. Uninformative features were dropped (e.g., listing id). Missing values were set to zero and a new binary feature was added to indicate the presence of a missing value. The resulting .csv files were loaded into a SQLite database for storage and final processing. Categorical variables were encoded using one-hot-feature encoding. Outliers were eliminated based on visual inspection of the distributions and inspection of the URLs associated with the listing to identify obvious data entry errors. Sadly, the $135,000/month data point was real (Fig. 5).
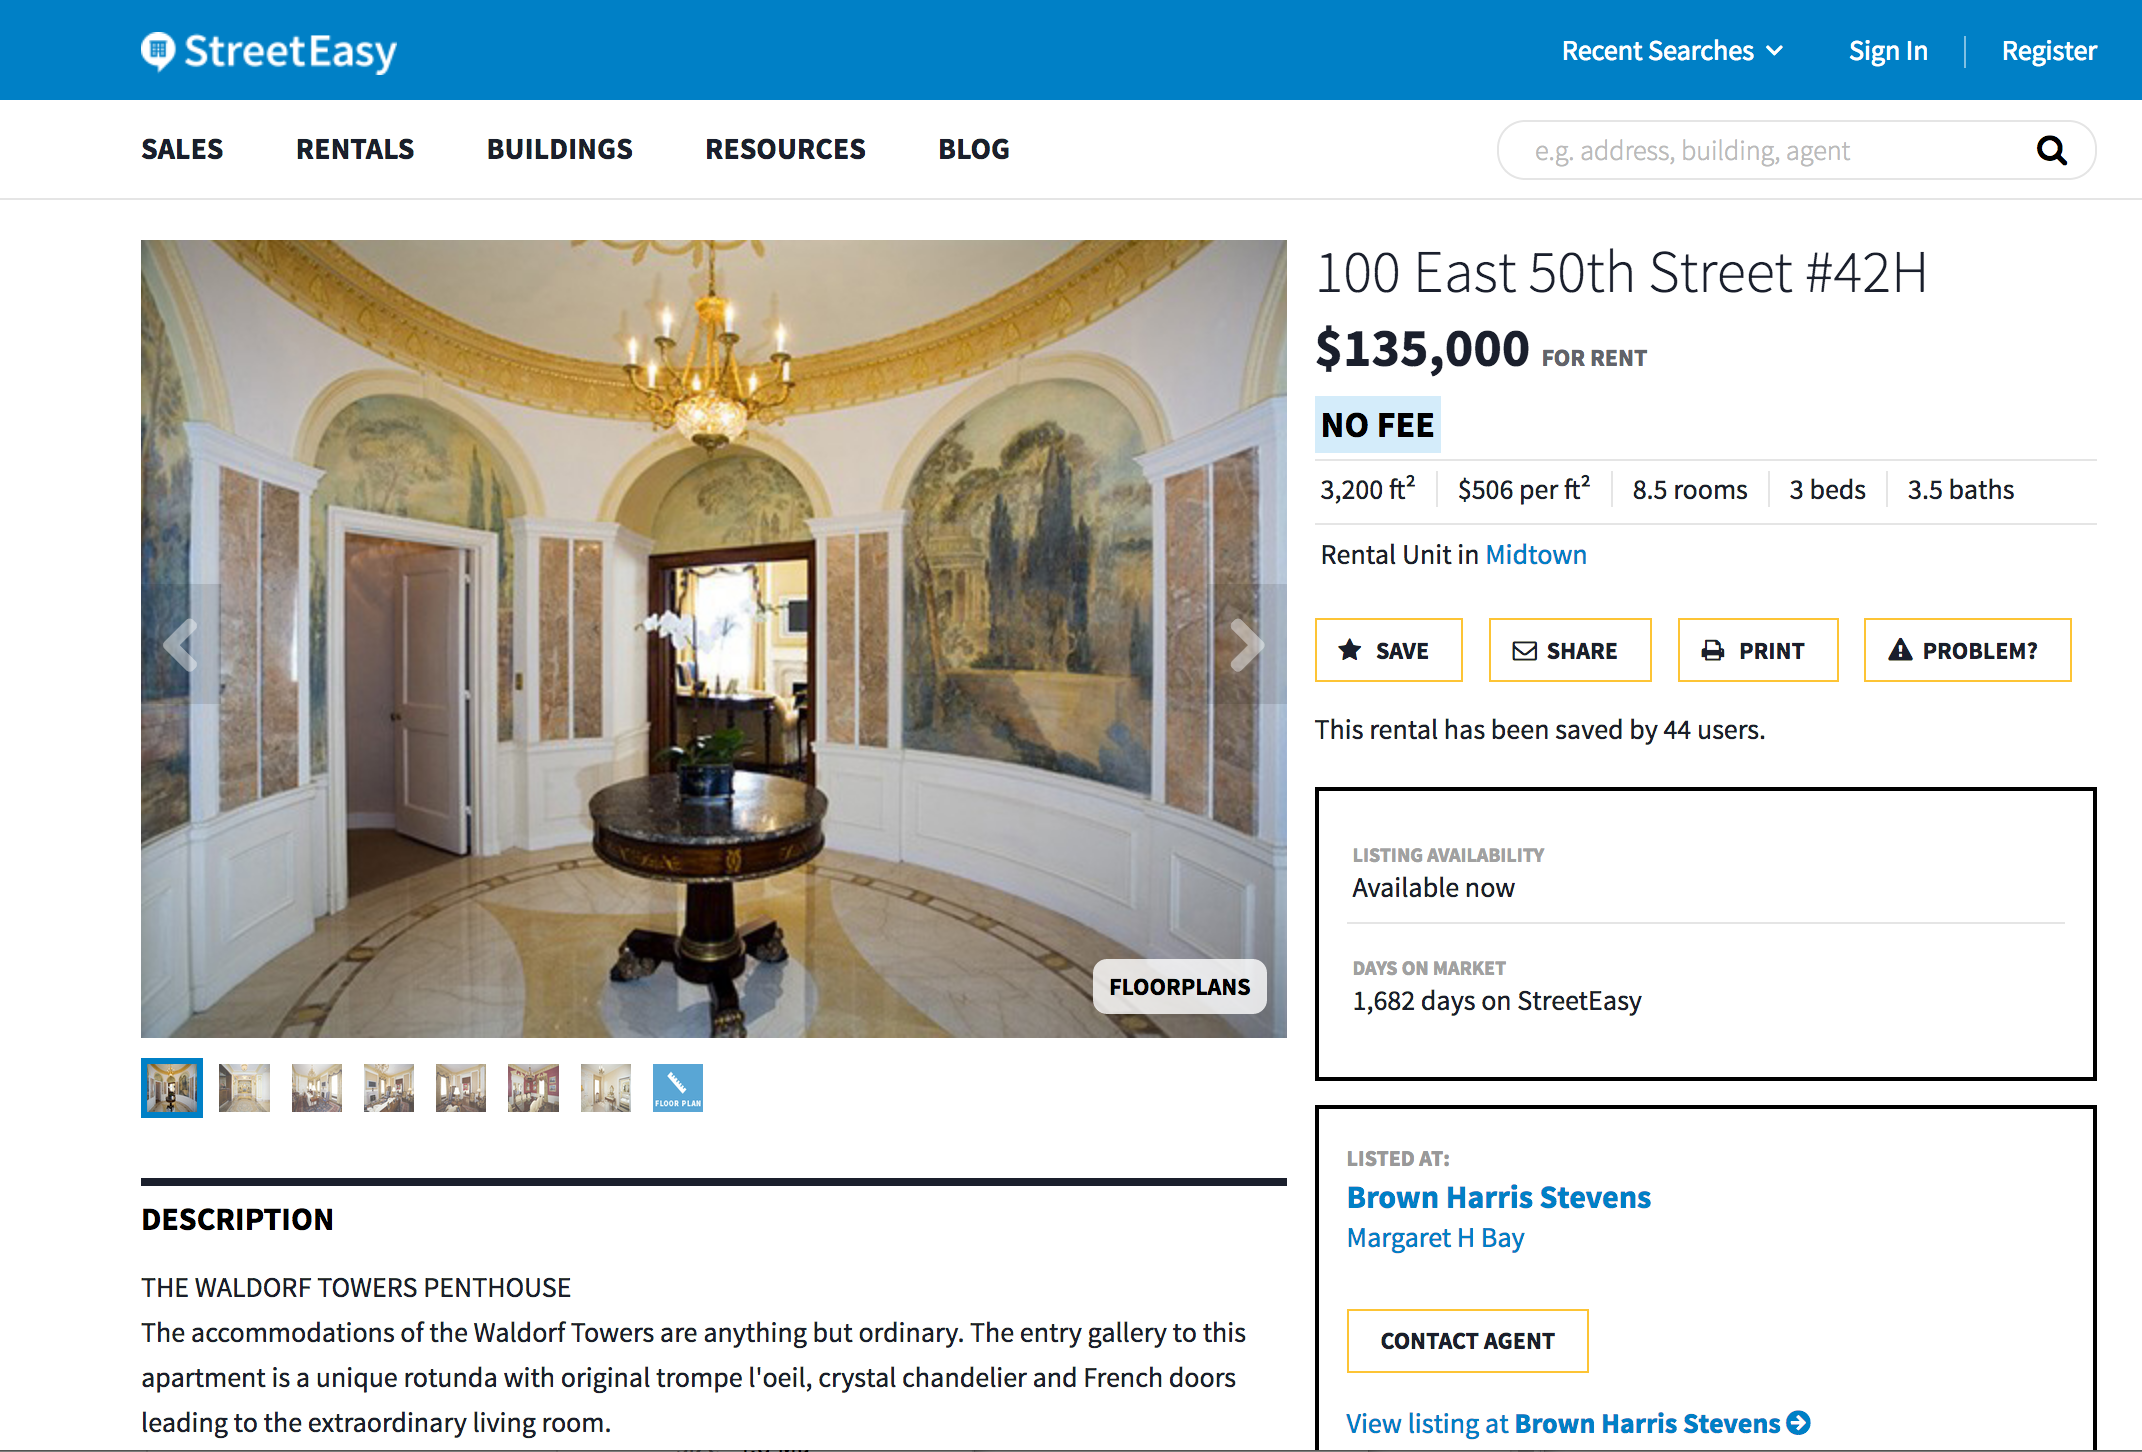
Figure 5. Not a data entry error! The most expensive listing in the data set.
Models
I evaluated a series of nested models to predict rental prices (i.e., a stepwise regression approach). For simplicity, I only used L1-regularized linear regression. The models used progressively larger feature sets to determine which features were informative about rental unit price. The models included the following:
- (1) Baseline features, that included only features available in the standard API (neighborhood, number of bedrooms, unit type).
- (2) Scraped features, that included additional basic information obtained through the web scraper (square footage, days on the market, total rooms, number of bathrooms).
- (3) Amenities features, that added features indicating the presence of certain amenities.
- (4) Transportation features, that included features encoding distance to each subway line.
- (5) Interaction features, that included interactions between neighborhood and other variables.
For model evaluation, I used a hold-out set from the last ten days of data (6,741 listings). I evaluated two metrics. The root mean squared error (RMSE) gives the standard deviation of prediction errors and R-squared provides a scale-free estimate of the proportion of variance explained by the model. Both statistics were evaluated using the holdout set to control for over-fitting.
I used a non-parametric bootstrap to asses the statistical significance of prediction accuracy across models. For efficiency, the bootstrap was implemented in parallel on a high-performance computing cluster using Apache Spark with PySpark API. The code is publically available in the parallel_bootstrap repository.
The results are summarized in Fig 7. All models that included scraped features fit significantly better than the baseline model (all p < 0.05), affiriming the value of the scraped data set. Including amenities in the model significantly improved prediction accuracy, but including information about nearby transportation did not. This makes sense because distance to transportation is highly correlated with neighborhood features already present in the model. In addition, including interaction terms for neighborhood significantly improved the quality of fit.
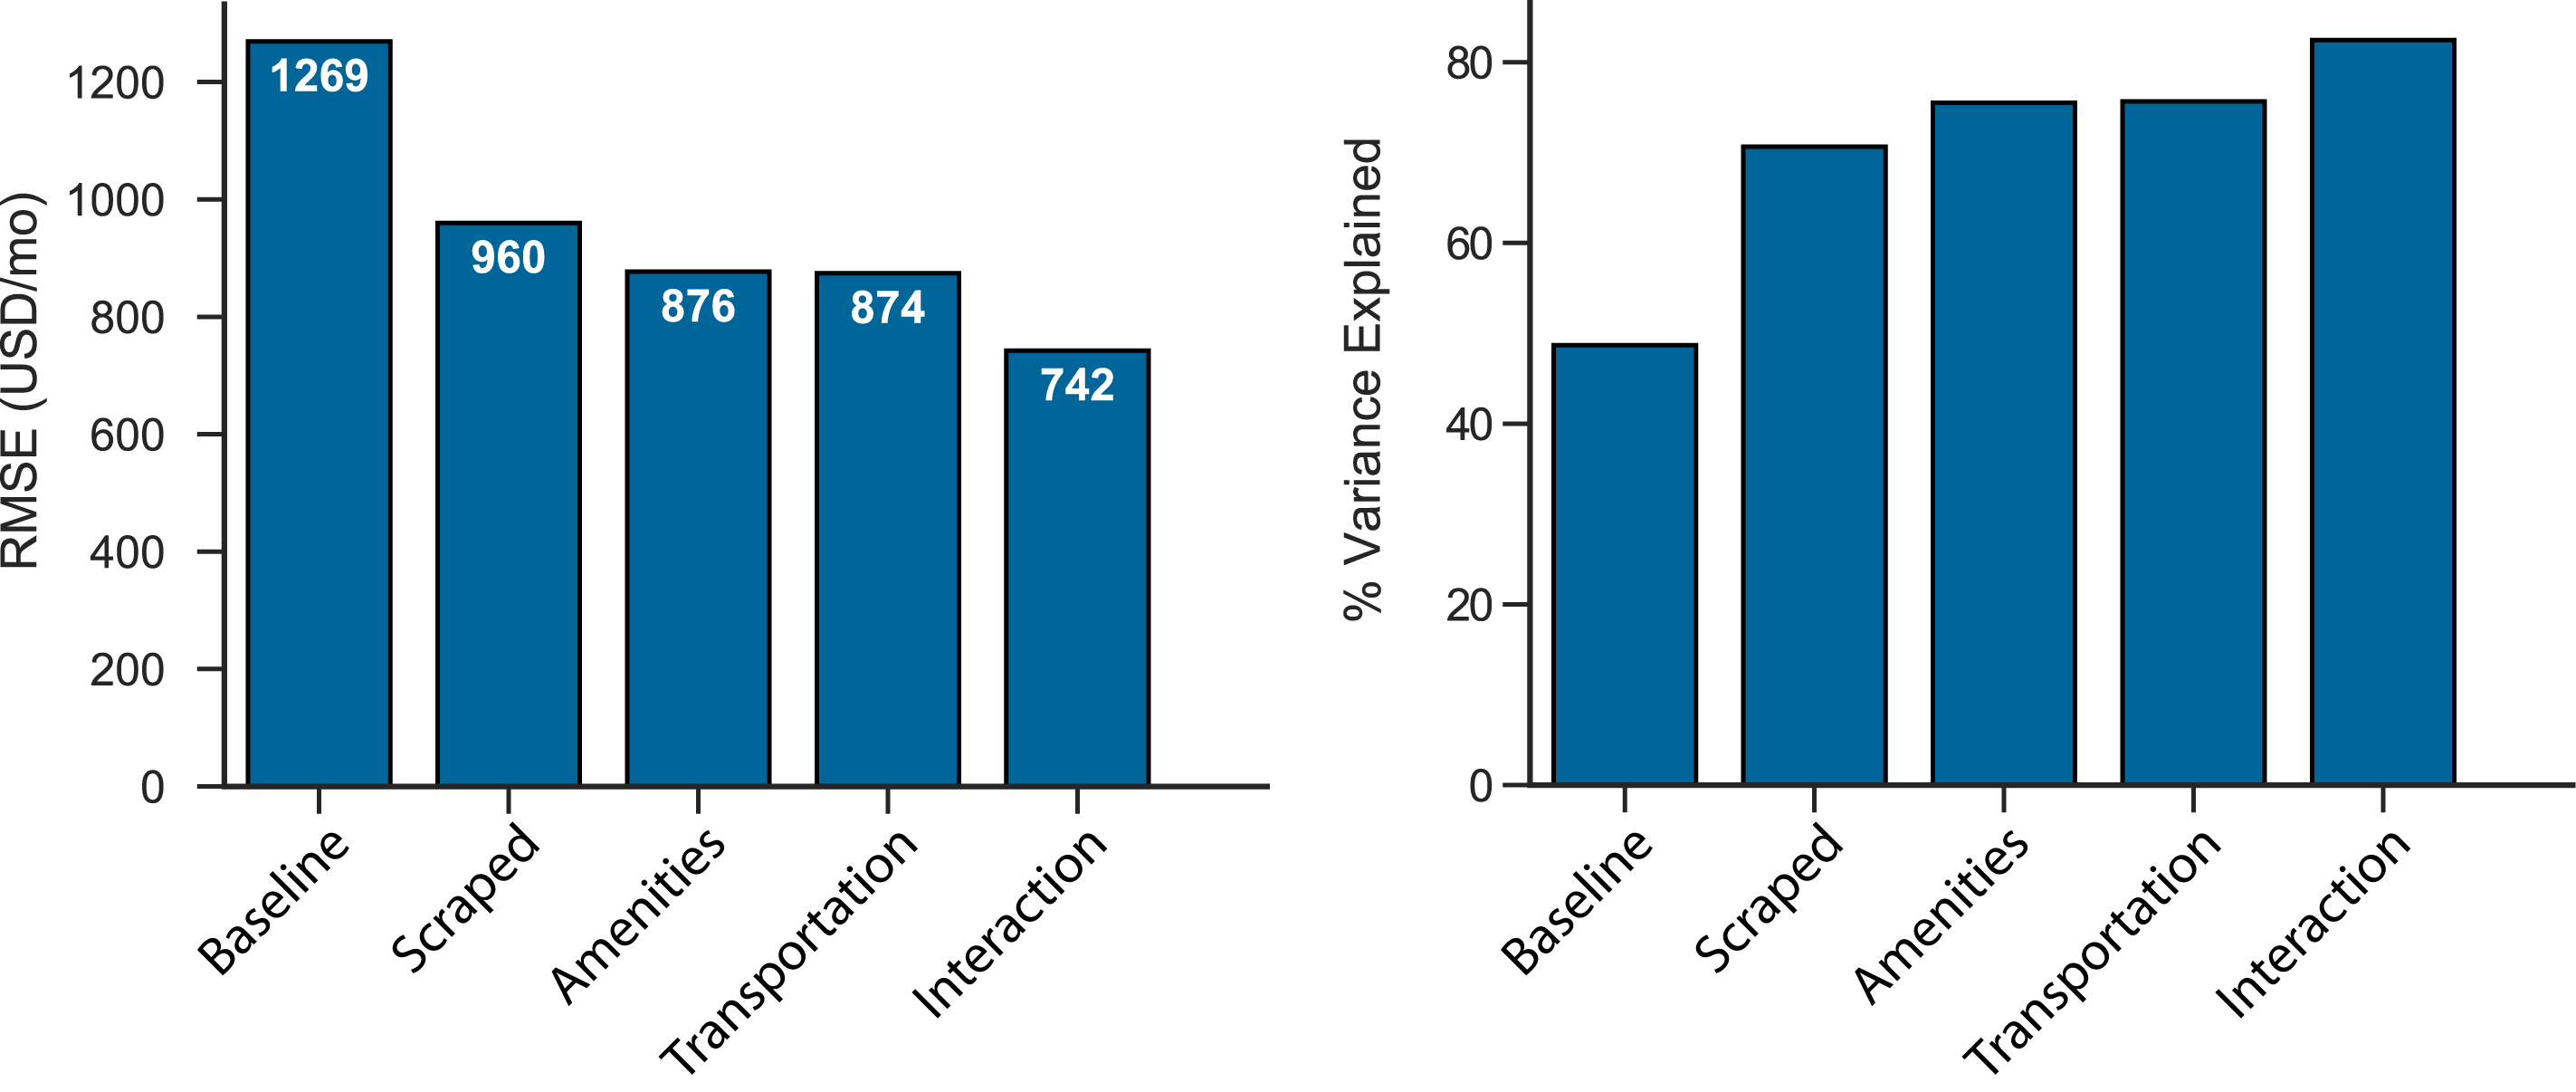
Figure 6. Cross-validated RMSE (left) and proportion variance expained (right) for the holdout data set.
Importantly, the best model explained over 80% of the variance in the data with RMSE below $800. This degree of accuracy is reasonable given the substantial variability in the data and numerous unmeasured factors that influence price. This provided a good basis to begin develop a prototype of the web application although the model could benefit from additional feature development.
RentApp
I developed a web application called RentNYC that provides an easy-to-use interface for non-technical users to compare predicted and observed rental prices. I developed the application was using Flask and the visualizations using d3.js. I used Twitter Bootstrap for frontend development. The application connects to a SQLite database that stores both data and trained model coefficients. You can download the source code and database from the rentnyc repository.
The app allows users to search for listings meeting their specifications and generates clear and simple visualizations comparing actual and expected prices for chosen units with a single click. An important features is that the plots include confidence intervals generated with parallel_bootstrap to clearly indicate whether an observed difference is meaningful. Try it out!.
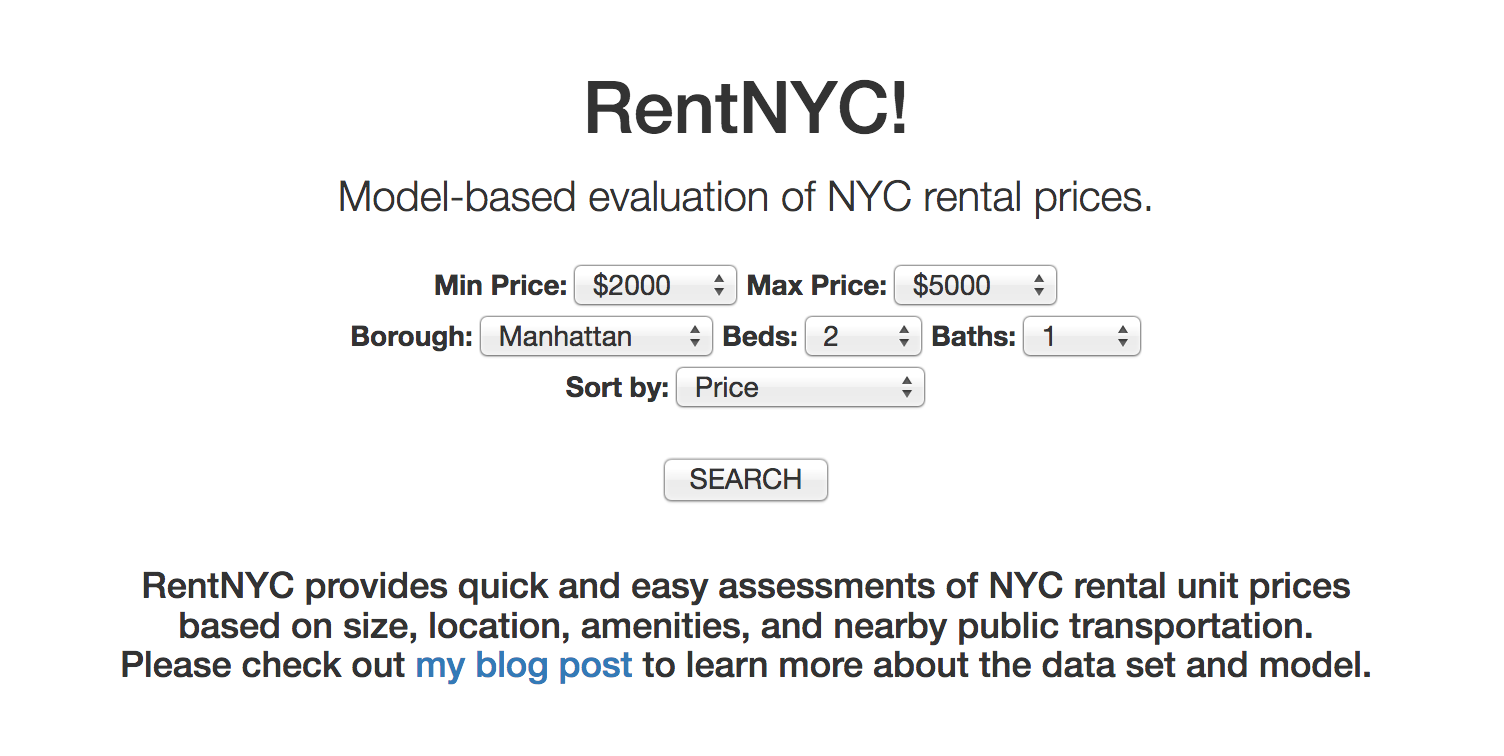
Figure 7. RentNYC home page.
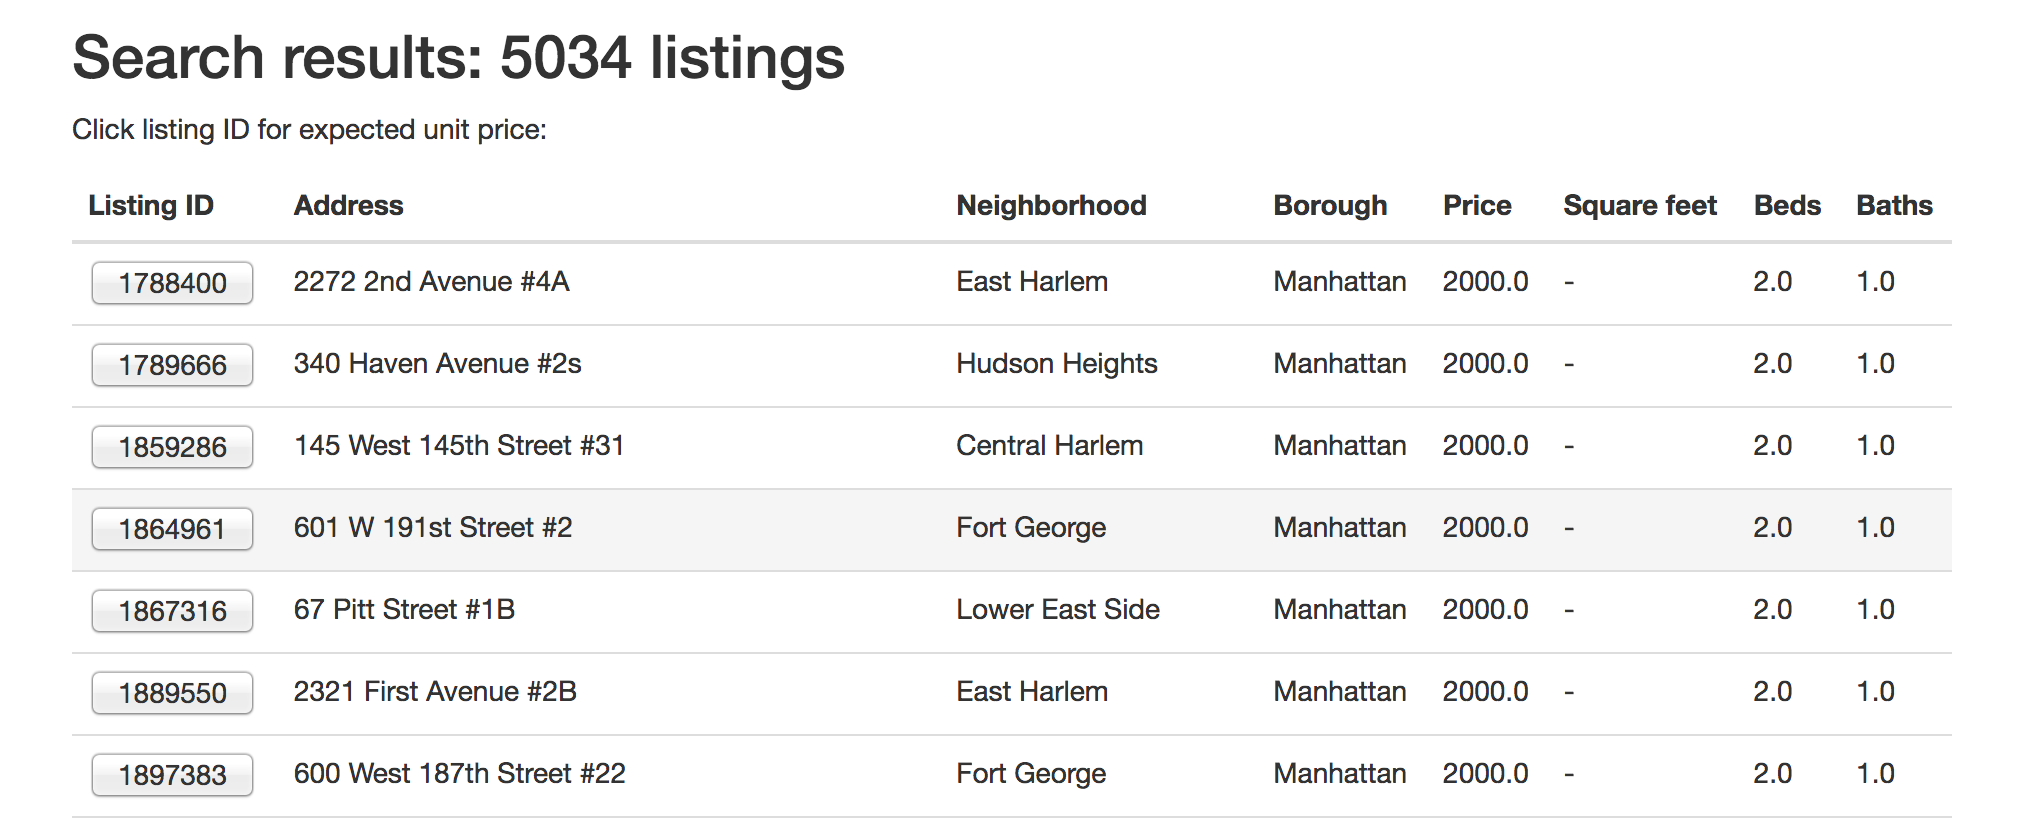
Figure 8. Example RentNYC search page.
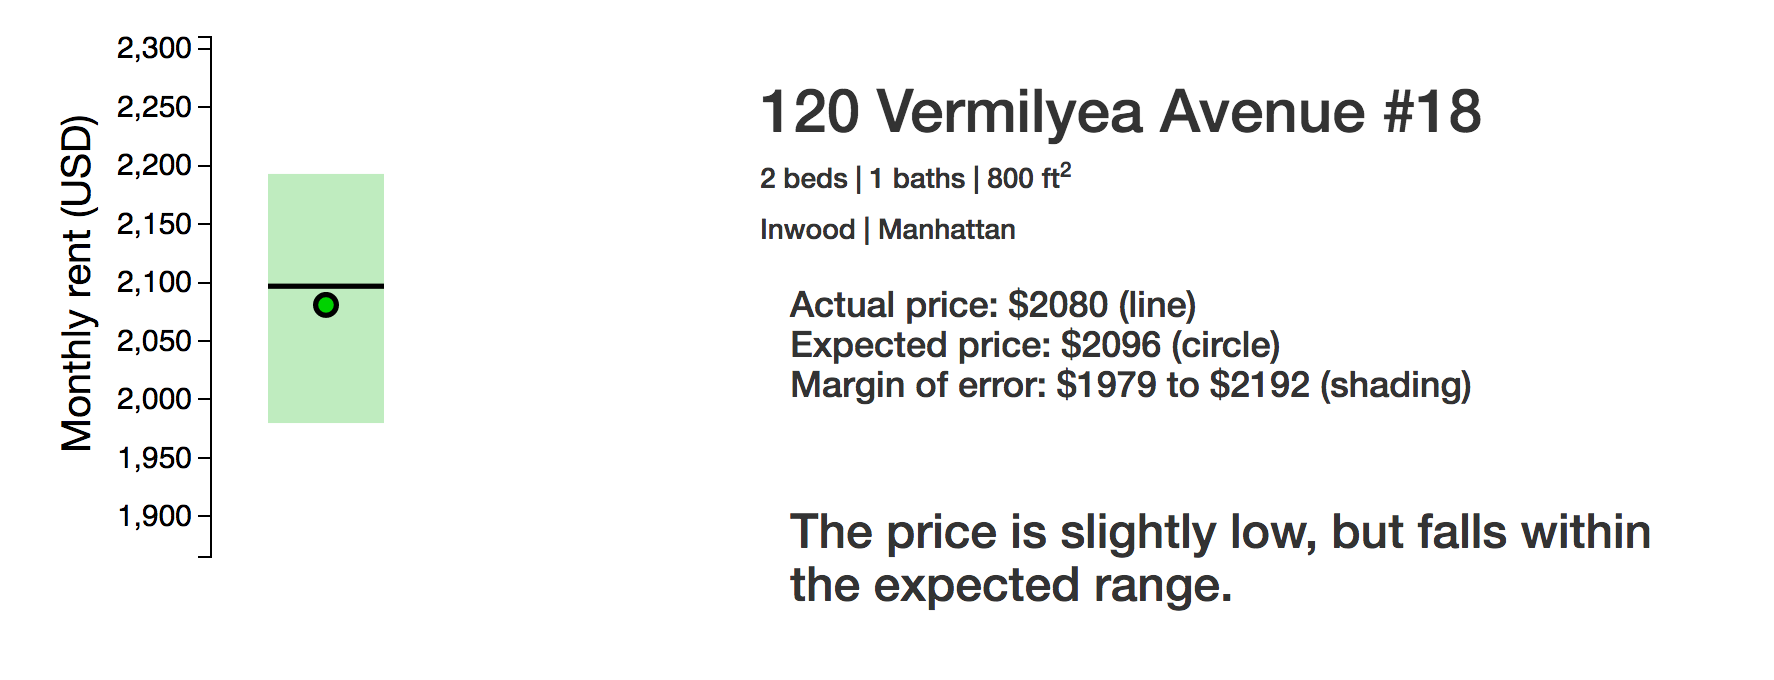
Figure 9. Example RentNYC results page.
Conclusions
I combined web scraping, machine-learning algorithms, cluster-based computing, and web development tools to extract value from data in multiple ways.
- I generated a new data set that provides detailed information about individual rental unit listings. The data set contains features that are not available on any freely accessible API. The data are cleaned and ready for modeling.
- I developed a model to predict housing prices and showed that I could explain over 80% of the variance in the pricing data (cross-validated). Future work could improve the prediction accuracy by testing nonlinear models.
- I developed a cluster-based program for bootstrapping confidence intervals to demonstrate which new features significantly improve the models predictive accuracy. The program is freely available and general enough to be used for other modeling problems.
- I developed a web-based tool that allows anyone to easily compare expected and actual prices of individual listings. This accomplishes the overall goal of developing a single metric for the evaluation of rental prices. The application is publically available and easy to use.
